These pages contain a detailed description of the model used in the paper "Macroscopic and Subcellular Factors Shaping Population Spikes" J. Neurophysiol., 83 (4): 2192-2208 by P. Varona, J. M. Ibarz, L. López and O. Herreras (2000). Particularly, the complete Hodgking-Huxley type description of the ionic channels is shown in section 3 and the exact distribution, with values for the maximum conductances and the electrotonic parameters for the different neurons, is depicted in section 7.
This pages should be read along with the paper for a better understanding.
Index:
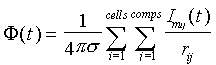
Our model is built using three levels: supracellular (field potentials
and CSDs obtained from the synchronous activity of a population of neurons),
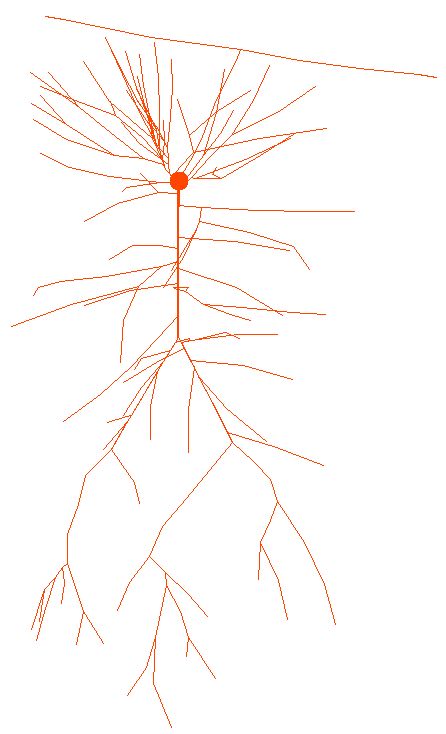
cellular (morphology and physiology of the single neurons that make up
the ensemble) and subcellular (electrotonic properties, ionic active channels
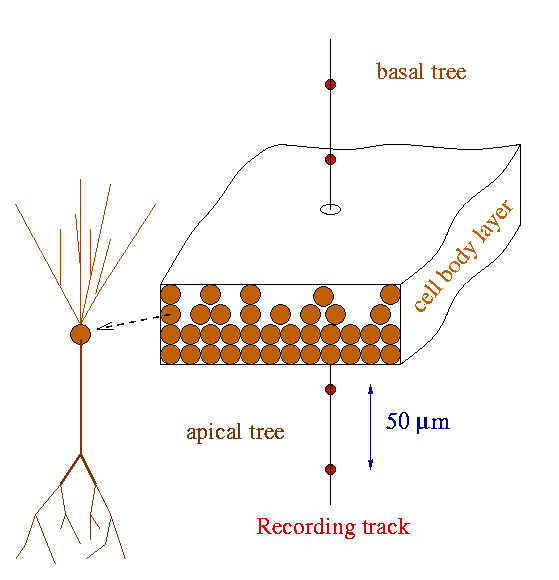
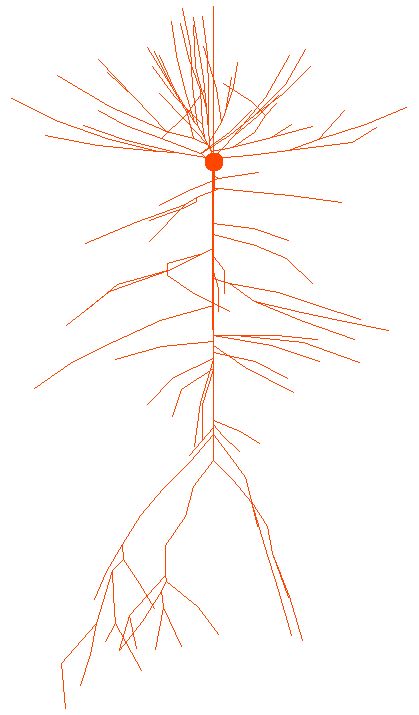
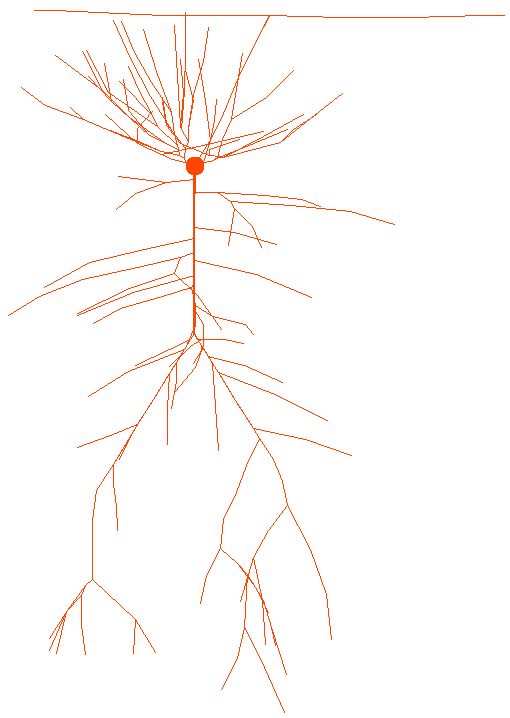
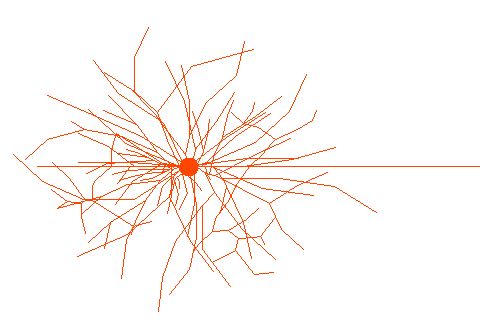
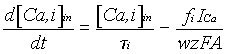
and calcium dynamics for each locus in the morphology). The dorsal CA1
region was modeled with aggregates of different size preserving an experimentally
observed cell density of 64 neurons in a 50x50 µm lattice (Boss
et al., 1987). The antero-posterior and latero-medial dimensions of
the aggregates were 0.05x0.05, 0.2x0.2, 1x0.35, 1x1, and 3x2 mm, corresponding
to 64, 1,024, 6,072, 17,424 and 104,544 morphologically identical model
neurons, respectively. The dimensions and cell number of the largest aggregate
can be taken as a rough estimation for the actual values for the dorsal
CA1 region. Three different spatial distribution of neurons were made with
their somata arranged either in a monolayer, 4 layers of even density,
or a realistic distribution of 4 uneven layers with 66% of somata in the
apical side and 22 and 11% in the two layers of the basal side (see schemes
in Figure 3 of the paper). Each neuron was rotated a random angle around
the somatodendritic axis to test that the particular morphology used in
our experiments introduced no artifacts in the field potential calculations.
The curvatures in the dorsal CA1 region were neglected for this study.
where sigma is the extracellular conductivity, Imijis the total transmembrane current at the jth compartment of neuron i, and rij is the distance from the recording point to that compartment. Thus, compartments are treated as point sources into a medium of homogeneous conductivity sigma. If the conductivity tensor were known for the CA1 tissue, a more detailed expression could be derived to calculate the field potential with higher accuracy (see Nunez, 1981). These calculations would have a high computational cost due to the presence of complex Bessel functions in the integration of the field potentials. The current density can be obtained (as in the experimental current source density analysis) through a Poisson equation which relates the field potential with the volumetric average of the transmembrane currents:
In a laminated structure such as the CA1 region the overall extracellular currents flow only in the dendrosomatic direction (z axis) and the analysis can be simplified in one dimension:
The prototype model neuron was built with an average dendritic branching pattern, and total dendritic length obtained from detailed morphometric studies (Bannister and Larkman, 1995 a,b; Trommald et al., 1995). The 3D morphology of the neuron was simulated using 265 compartments, distributed in an axon, (consisting of mielinized portions, Ranvier nodes, initial segment and axon hillock), soma and apical and basal dendritic trees (2D projections of the model neuron is shown in the figures above). Total effective area of the neuron was 66,800 microns2 (including spine area).
The electrotonic parameters of the model for the majority of the simulations were Rm=70,000 ohms×cm2, Ri=150 ohm×cm (75 for Results in Figs. 9 and 10), Cm=0.75 microF/cm2. Values of Rm and Cm at the dendritic compartments were compensated to take into account spine area. Input resistance at the soma was 140 Mohms, and tau was 25 ms. See neuron scripts for the exact values of the electrotonic parameters used for each neuron prototype.
CHANNEL DESCRIPTIONS:
1. Soma and dendrite channels:
We used seven ionic channels to simulate the active properties of the somatodendritic membrane: sodium (Na+), calcium (Ca++), and five potassium currents: delayed rectifier (DR), small persistent muscarinic (M), A-type transient (A), short-duration [Ca]- and voltage-dependent (C) and long duration [Ca]-dependent (AHP). Conductance variables were described with Hodgkin-Huxley type formalism. The kinetics of all these channels has been obtained from Warman et al. (1994) with the following modifications:Here we reproduce the description of all channels in the standard Hodgkin-Huxley notation:
- Equilibrium potentials were +45 and -85 mV for Na+ and K+, respectively.
- The activation time constant for the Na+ channel was still halved due to the faster rising slope of in vivo APs.
- For the Ca++ channel a temperature of 35ºC was used in the Nernst equation, ECa = -13.275Ln([Ca,1]in/[Ca]o), where [Ca]o is 1.2 mM and [Ca,1]in refers to pool number 1 (see the description for the calcium dynamics).
- For the C-type K+ channel, alphac = -0.0077(Vm+Vshift+103)/{exp[(Vm+Vshift+103)/-12]-1}.
Na channel:INa = gNam3h(Vm-ENa)
ENa = 45 mV
alpham = -3.48(Vm-11.0)/{exp[(Vm-11.0)/-12.94]-1}2. Axon channels:betam = 0.12(Vm-5.9)/exp[(Vm-5.9)/4.47]-1}
alphah = 3/exp[(Vm+80)/10]
betah = 12/{exp[(Vm-77)/-27]+1}
Ca channel:
ICa = gCas2r(Vm-ECa)
ECa = -13.3Ln([Ca,1]in/1200)
alphas = -0.16(Vm+26.0)/{exp[(Vm+26)/-4.5]-1}
betas = 0.04(Vm+12)/exp[(Vm+12)/10]-1}
alphar = 2/exp[(Vm+94)/10]
betar = 8/{exp[(Vm-68)/-27]+1}
Nernst coefficient was calculated for a temperature of 35° C, and external calcium concentration was set to 1.2mM.
K_C channel:
IC = gCc2d(Vm-EK)
EK = -85 mV
alphac = -0.0077(Vm+Vshift+103)/{exp[(Vm+ Vshift +103)/-12]-1}
betac = 1.7/exp[(Vm+Vshift+237)/30]
Vshift = 40Log([Ca,1]in)-105
tauc = 1.1 ms
alphad = 1/exp[(Vm+79)/10]
betad = 4/{exp[(Vm-82)/-27]+1}
K_AHP channel:
IAHP = gAHPq(Vm-EK)
EK = -85 mV
alphaq = 0.0048/exp[(10Log([Ca,2]in-35)/-2]
betaq = 0.012/exp[(10Log([Ca,2]in+100)/5]
tauq = 48 ms
K_M channel:
IM =gMu2(Vm-EK)
EK = -85 mV
alphau = 0.016/exp[(Vm+52.7)/-23]
betau = 0.016/exp[(Vm+52.7)/18.8]
K_A channel:
IA =gAab(Vm-EK)
EK = -85 mV
alphaa = -0.05(Vm+20)/{exp[(Vm+20)/-15]-1}
betaa = 0.1(Vm+10)/{exp[(Vm+10)/8]-1}
alphab = 0.00015/exp[(Vm+18)/15]
betab = 0.06/{exp[(Vm+73)/-12]+1}
K_Ap channel (see additional notes):
IAp =gApa4b(Vm-EK)
EK = -85 mV
ainf = 1/{exp[(-Vm-5)/10]+1}
taua = 0.15ms
binf = 1/{exp[(Vm+56)/8]+1}
taub = 5ms if Vm<-30 mV and 5+0.26(Vm+30) if Vm>30 mV
K_Ad channel (see additional notes):
IAd =gAda4b(Vm-EK)
EK = -85 mV
ainf = 1/{exp[(-Vm-15)/8]+1}
taua = 0.15ms
binf = 1/{exp[(Vm+56)/8]+1}
taub = 5ms if Vm<-30 mV and 5+0.26(Vm+30) if Vm>30 mV
K_DR channel:
IDR =gDRn4(Vm-EK)
EK = -85mV
alphan = (-0.018Vm)/[exp(Vm/-25)-1]
betan = 0.0036(Vm-10)/{exp[(Vm-10)/12]-1}
In the axon, Na+ channels were identical as for the somatodendritic membrane, while the DR-type K+ channel was obtained from Traub et al. (1994):
K_DRA channel:3. Ca dynamics:IDRA =gRTAnax4(Vm-EK)
EK = -85mV
alphan(ax)= -0.03(Vm+47.8)/{exp[(Vm+47.8)/-5]-1}
betan(ax) = 0.45exp[(Vm+53.0)/-40]
As described by Warman et al. (1994) and Borg-Graham (1998), the [Ca]i was simulated with two different Ca pools with different time constants, tau1 = 0.9 ms for the calculation of ECa and modulating the C-type K+ current and tau2 = 1 s for the AHP-type K+ current, as follows:
Where taui is the i-th calcium pool removal time constant, fi is the fraction of Ca influx affecting the i-th pool (f1=0.7, f2=0.024), w is the diffusion thickness (1 micron), A is the compartment area, z is the valence of the calcium ion and F is Faraday's constant.
4. Additional notes:For the neuron prototype 4 in Figure 7 and also in figures 9 (Ortho-1, Anti), 10 (Anti-ctrl, Anti-cond) and in figure 9 (Ortho-2) we used an A-type K+channel modified from Hoffman et al (1997) with a different description for proximal and distal dendrites (K_Ap and K_Ad as defined above).
Since the objective of this work is to simultaneously reproduce both AP parameters and the aggregate PS profile, the channel distributions along the cell morphology have been continuously tuned in a feed-back manner. The detailed distribution of channels along the morphology can be obtained from the neuron scripts.
Simulation of antidromic stimulation was made by 1 nA, 0.1 ms long pulses injected in the Ranvier node (compartment named 'r3' in the neuron scripts) of each cell in the population. We used a binomial distribution to set the activation time for each neuron in the assembly in order to simulate the temporal jitter. Synaptic activation was simulated with alpha functions as follows: gsyn(t) =(t/tausyn){exp(1-t/tausyn)}. The synaptic currents are defined as Isyn = gsyn(t)(Vm-Esyn), with tausyn of 2, 7, and 30 ms and reversal potentials of 0, -75, and -85 mV, for AMPA, GABAA and GABAB mediated currents, respectively. GABAA currents were distributed in the soma and proximal apical shaft, and turned on 1.5 ms after antidromic activation, while GABAB currents were distributed throughout most of the apical tree and activated along with the former, both 1.5 ms after AMPA-type currents initiation, for orthodromic activation. See neuron scripts for the detailed description of the distribution of the synapses.
Compartimental transmembrane currents were calculated using the GENESIS simulator (Bower and Beeman, 1998). Calculations of Field potentials and CSDs were programmed in dedicated C code.
- Bannister, N.J., and Larkman, A.U. (1995a). Dendritic morphology of CA1 pyramidal neurones from the rat hippocampus: I. Branching patterns. J. Comp. Neurol. 360, 150-160.
- Bannister, N.J., and Larkman, A.U. (1995b) Dendritic morphology of CA1 pyramidal neurones from the rat hippocampus: II. Spine distributions. J. Comp. Neurol. 360, 161-171.
- Borg-Graham, L.J. (1998). Interpretation of data and mechanisms for hippocampal pyramidal cell models. In Cerebral Cortex, Vol. 13: 'Cortical Models', P. S. Ulinski, E. G. Jones and A. Peters, eds., (New York: Plenum Press), 19-138.
- Boss, B.D., Turlejski, K., Stanfield, B.B., and Cowan, W.M. (1987). On the numbers of neurons in fields CA1 and CA3 of the hippocampus of Sprague-Dawley and Wistar rats. Brain Res. 406, 280-287.
- Bower, J.M., and Beeman, D. (1998) The book of Genesis. Exploring Realistic Neural Models with the GEneral NEural SImulation System. 2nd Edition (New York: Springer Verlag).
- Hoffman, D.A., Magee, J.C., Colbert, C.M., and Johnston, D. (1997). K+ channel regulation of signal propagation in dendrites of hippocampal pyramidal neurons. Nature 387, 869-875.
- Nunez, P.L. (1981). Electric Fields of the Brain: The Neurophysics of EEG. Oxford University Press, Oxford.
- Traub, R.D., Jefferys, J.G.R., Miles, R., Whittington, M.A., and Tóth, K. (1994). A branching dendritic model of a rodent CA3 pyramidal neurone. J. Physiol. 481, 79-95.
- Trommald, M., Jensen, V., and Andersen, P. (1995). Analysis of dendritic spines in rat CA1 pyramidal cells intracellularly filled with a fluorescent dye. J. Comp. Neurol. 353, 260-274.
- Warman, E.N., Durand, D.M., and Yuen, G.L.F. (1994). Reconstruction hippocampal CA1 pyramidal cell electrophysiology by computer simulation. J. Neurophysiol. 71, 2033-2045.